A Blog of Flashbacks The History of the Behavioral Therapies
October 2023
Og Lindsley received his PhD under the well-known psychologist, B. F. Skinner. I received mine under Lindsley. What did Og Lindsley do that was unique? Three things. First, Skinner told him to teach four rats to high jump. Instead, Og watched the behavior of one of them, Samson Rat, pull down on the edge of the meter stick. ‘Hm,’ he thought,’ let’s go with what this Samson Rat does.’ Og put “an adjustable sliding weight on the meter stick” and taught him to lift the weight. As he said in his chapter in the book, The History of the Behavioral Therapies: Founders’ Personal Histories, “I put a ring handle on the end of a meter stick, because his paws kept slipping off. Within a week of daily training, Samson Rat was pulling down a weight equal to his own body weight.” Then Og saw Samson Rat put his foot against the wall of the box, but his foot kept slipping. Og ran out of the lab to the Harvard Coop, bought a rubber stair tread, ran back to the lab to place a bit of it against the cage wall. Samson’s foot no longer slipped. He eventually lifted two and a half times his own weight.
Meeting his desire to understand human behavior, Og did his second unique thing—he moved from animals to humans. He was the first person to take the principles and practices of Skinner’s operant conditioning to human behavior. He started with his youngest daughter, Kathy, in the Air Crib Skinner had developed for his younger daughter. It controls air temperature and humidity, and allows the child to sleep, see and hear what’s going on in the house, and move without a myriad of extra clothing. The front of the Air Crib is unbreakable glass. Debbie Skinner spent hours outside the Air Crib with her parents and playing with her older sister, Julie. Both of Skinner’s daughters are well-educated, and productive members in society. The older one, Julie, is a behavior analyst, a colleague and friend of mine. The younger, Debbie, is a successful artist. Kathy Lindsley is now a retired social worker.
Og’s research with animals in the lab and his World War II experiences and Skinner’s development of the Air Crib, prompted Og to rear his youngest daughter in her infancy in an Air Crib. A year later, in 1953, Og started the Behavior Research Laboratory at Metropolitan State Hospital in Waltham, Massachusetts. Waltham was thirteen miles from our house toward Boston. Some laundry service in Waltham came once a week to pick up our towels, sheets, and any other laundry my mother didn’t do at home. An odd connection for the location and research occurring there that would become so important to me thirteen years later.
Coming from an undergraduate degree in psychology and a master’s degree in experimental psychology, Ogden knew ratio-ratio, semi-logarithmic, and equal interval graphs well. He experimented with all three. The cumulative recorder, developed by Skinner, gave the patterns of behavior in a given time, or the rate or frequency of the behavior of a rat, pigeon, or dog. The recorder weighs just under three pounds and measures 5.5 x 1.5 x 8.25 inches. It can only deal with one organism’s behavior at a time.
How did he get from training Samson to Kathy in the Air Crib to psychotic patients at Met State Hospital to supervising work with children in classrooms? Twenty-five of those cumulative recorders in an elementary classroom? Bad idea for being costly and cumbersome. How do we get measuring behavior out of the lab into a classroom?
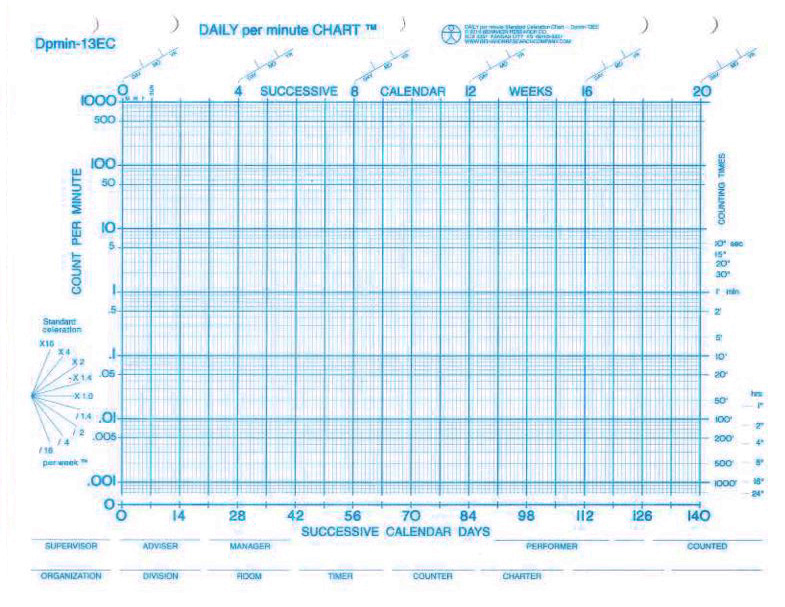
The third revolutionary event occurred when Lindsley developed the paper semi-log standard celeration chart with its basis of frequency. When teaching graduate classes in special education at the University of Kansas Medical School, students came in with different graphs. Each person took about half an hour to explain the graph and describe the data. Thirty minutes, what a waste of time! Needing to be more efficient, and based on his background, he and three students began to develop a standard graph, called the standard behavior chart.
He needed a paper chart he could take into a special or regular education classroom in any school. The first printed one came in September 1967. I learned to use it that fall in a University of Oregon graduate class called Precision Teaching.
I grew up in a home that depended much on science and precision of language, this semi-logarithmic blue chart hooked me on the first day I began to use it. I decided that day if I found any way to measure human behavior more precisely, I’d switch. As of today, October 15, 2023, I still use the standard celeration chart every day.
 |
A standard celeration chart. |
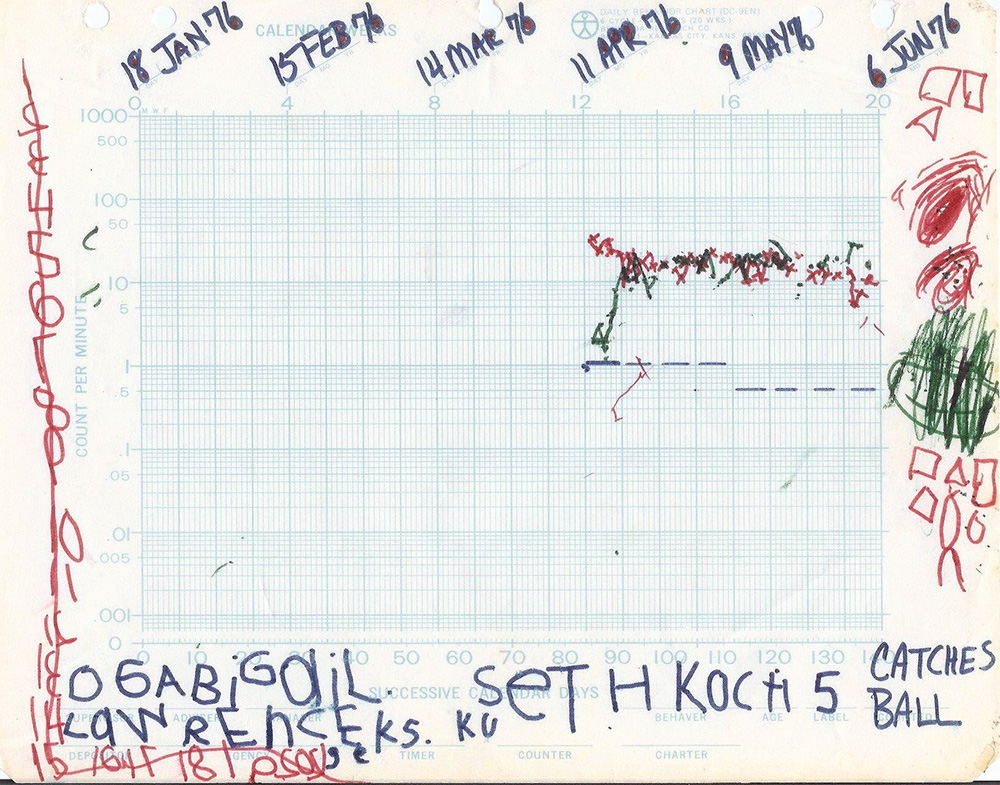
We can look at all kinds of behaviors—a child learning to catch a ball with his friends instead of closing his eyes and turning his head away. I had a bucket of 50 tennis balls and threw about 45 a minute to him. Catches the ball is green. Doesn’t catch the ball is red. Seth decorated his chart. ‘It’s my learning. It’s my chart. I’ll make sure it’s mine!’ One minute practice was too short. Lowering it to two minutes his catches the ball went up and his misses went down.
 |
Standard celeration chart 1. Seth catches a tennis ball. |
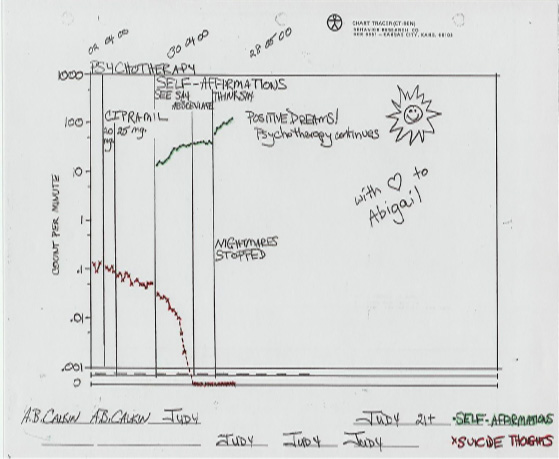
Judy is a retired teacher of special needs children. At the time of this project, she also was in psychotherapy. Her suicide thoughts ranged from 95 to 151 a day. Because they were so high, she counted for only three days before beginning an intervention of 20 mg of Celexa. This did not make much difference to her suicide thoughts, reducing them only to a range between 90 and 120. The Celexa was increased to 25 mg, and the suicide thoughts reduced in 2 weeks from the mid-90s to 50, a ÷1.4 or a 40% decrease in 12 days.
Still not happy with this, in addition to the interventions of psychotherapy and medication, Judy began to read her list of self-affirmations for a minute a day. Immediately (in one day), she had a significant jump-down (62%) from 52 to 32 suicide thoughts a day. These harmful thoughts continued to decelerate, reaching zero eleven days later. This is a decrease of ÷30, or a 96.7% decrease in a week and a half. That’s huge!
Celexa is a drug that takes two to four weeks before its effectiveness shows, and patients are advised to stay on it for about 6 months to be sure the symptoms are gone. While the first 16 days of the drug’s use showed a slight decrease in Judy’s suicide thoughts, the implementation of the 1-min timing on affirmations showed a large decrease in her suicide thoughts. Rather than staying on the medication for an additional 5 months, when these negative thoughts were at zero, Judy stopped the Celexa with no increase in suicide thoughts. At the same time, she began to abbreviate the self-affirmations. Eight days later, with her suicide thoughts still at zero, her nightmares stopped and she changed her reading of self-affirmations to a think-say, or just saying them to herself. Psychotherapy continued. Fifteen years later, she had not had any suicide thoughts that prompted her to take up counting and charting them.
 |
Standard celeration chart 2. Judy’s suicide thoughts and self-affirmations. |
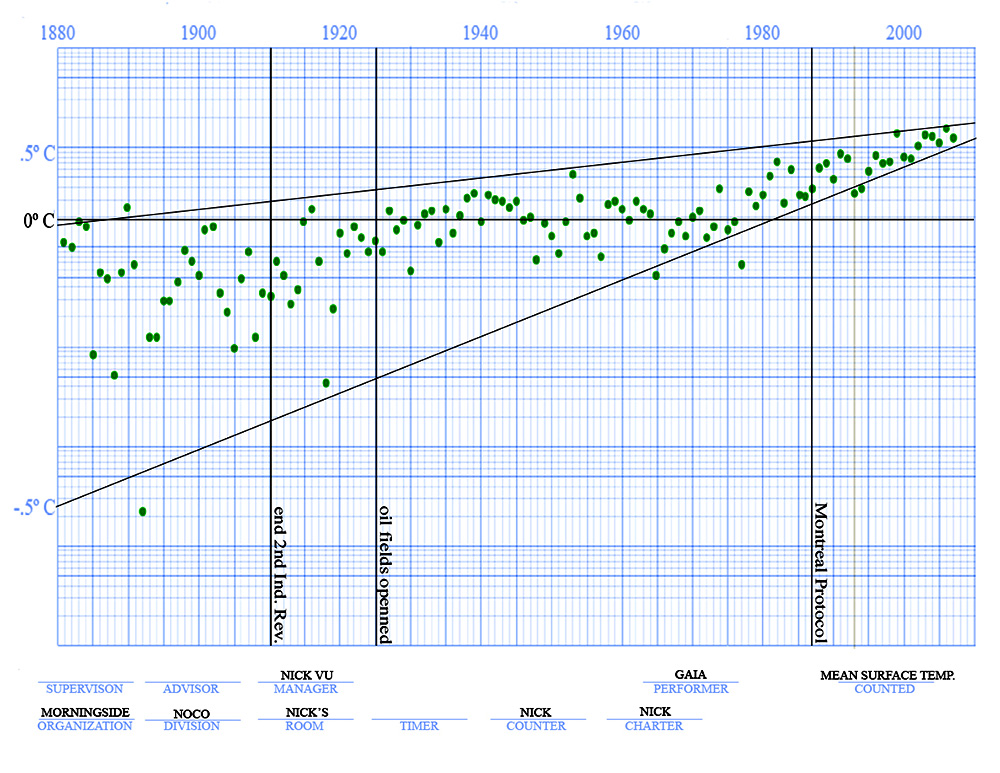
Or we can take a look at temperature change from 1881 to 2007 on a yearly chart. Their rise correlates with the opening of oil fields. Notice how the range, the distance between the two black trend lines, narrows across the chart. The planet’s mean surface temperature consistently began to go above freezing in 1925. Since 1957, it has not gone below freezing.
 |
Standard celeration chart 3. Mean surface temperature planet Earth. |

|
